Features
PricingHow it worksGigx co-pilotAppsHelp CenterBlogAboutFAQContactالعربية

Dental Practice Management Software — With an Interactive Tooth Chart

32-tooth chart with FDI notation, color-coded ADA codes, surface tracking, and per-treatment status — built specifically for dentists.
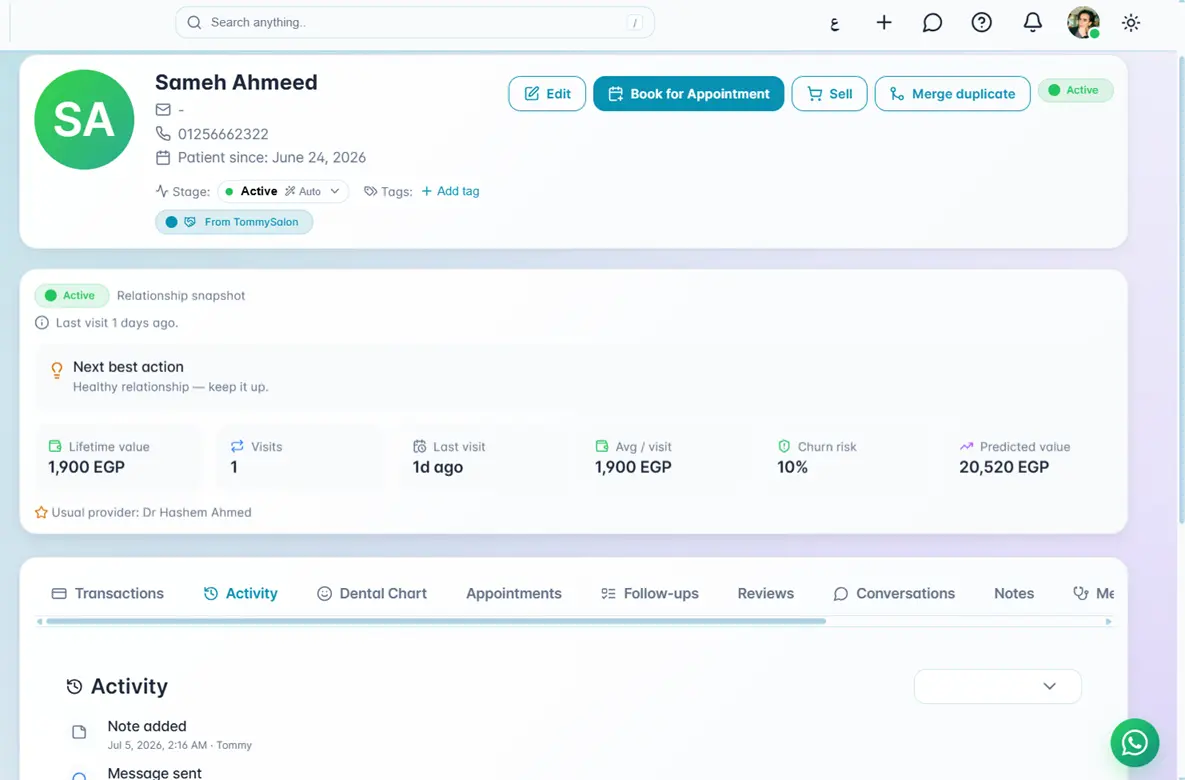
Every patient's chart and treatment history
Orcaa patient record showing a dental patient's treatment history

Challenges every dentist knows

Notes scattered tooth by tooth

Paper records per visit, with no clear way to see one tooth's history across multiple appointments.

Crown and filling history gets lost

Which tooth was treated, when, and with what procedure? Hard to track without a unified digital archive.

Manual ADA coding is exhausting

Entering codes per procedure and per surface eats clinic time and creates errors in insurance claims.

No full-mouth view per patient

Treatment planning needs a visual overview of the entire mouth — text lists are not enough.

Everything your dental clinic needs — on one screen

Tools designed for the way dentists actually work

Interactive 32-tooth dental chart
Full FDI notation (U1–U8 upper, L1–L8 lower). Click any tooth to log a new treatment or pull up its full history with one tap.
Tooth-specific or arch-based treatments
Record a treatment on a single tooth, or apply it to an entire arch (upper, lower, full mouth) for whitening and deep cleaning procedures.
Color-coded ADA procedure codes
Extractions, fillings, crowns, implants, root canals, whitening, cleaning, braces… each category has its own color and code — visible at a glance on the chart.
Surface tracking
Occlusal, mesial, distal, buccal, lingual, cervical — pinpoint exactly where the work was done, essential for insurance and clinical follow-up.
Per-treatment status workflow
Planned → in-progress → completed (or cancelled). Every status change is timestamped and can be linked to a booking.
Complete patient treatment history
Full timeline of every restoration, extraction, and procedure — with dates, surfaces, and ADA codes — right inside the patient file.

Crowns and dentures, tracked from impression to fitting

Every piece you send to the dental lab — which patient, which lab, what it costs, and when it's due back — without a single phone call

A lab case for every piece
Crown, bridge, veneer, denture, implant restoration, aligner, night guard… record the patient, the teeth, the shade and material (zirconia, e-max, PFM), and the price you agreed with the lab.
Live status from sent to fitted
Sent → in lab → try-in → received → fitted. The whole clinic sees where every case stands, and remakes are tracked with their reason and count.
Never seat a patient before the crown is back
Due-date reminders warn you before a case runs late — and flag any case due back after the patient's next appointment, while there's still time to act.
A monthly statement for every lab
"5 zirconia crowns × your price" — pieces made each month grouped by type, at the prices you entered, plus total billed, what you've paid, and what's still owed.
Judge labs by their numbers
Remake rate and average turnaround per lab, tracked automatically — choose who gets your next case with data, not gut feeling.
Patients told the moment it arrives
When a piece comes back from the lab, the patient is notified automatically — and reception and the dentist too — so fitting appointments actually happen.

Turn the chart into revenue you can see

The financial half of the dental chart — every procedure becomes a number on your dashboard, in your reports, and in the AI's answers.

Dental revenue on the dashboard
Treatment income shows up as its own layer in the revenue breakdown and the stacked revenue chart — alongside bookings, packages, and POS — so you see exactly where money came from.
Planned-treatment pipeline
Every procedure on a patient's chart that hasn't been completed is tracked as pipeline value. See "you have 87,000 EGP of planned treatments waiting" the moment you open the dashboard.
Procedure performance report
Rank every procedure by realized revenue, treatment count, completion rate, and unique patients. Spot which procedures actually pay the bills — and which are just busywork.
Daily / weekly / monthly with dental
Standard reports now include treatment counts, status breakdown, and dental revenue alongside bookings and POS — one report covers your whole clinic.
Top patients by treatment value
Customer Insights ranks patients by realized treatment revenue, so you know who's worth a personal follow-up call before they drift away.
Ask Gigx in plain Arabic or English
"Show me top procedures this month." "What's our planned pipeline?" "أفضل علاجات الأسنان هذا الشهر؟" — Gigx reads your numbers live and answers in plain language, with deep per-patient analysis on every plan

Real dental clinics, documented results

"The interactive chart changed how I present treatment plans. Patients understand more and accept faster — and every tooth's history is one tap away."
Dr. Ahmed FawzyAl-Nour Dental Clinic — Nasr City, Cairo

Frequently Asked Questions

Does the chart support FDI or Universal notation?

FDI is the default and fully supported, with optional switch to Universal notation for those who prefer it.

Can I record a full-arch treatment, not just a single tooth?

Yes. Pick upper arch, lower arch, or full mouth for procedures like whitening and deep cleaning.

Are ADA procedure codes pre-loaded?

Yes. Every category (extraction, filling, crown, implant, root canal, whitening, cleaning…) has its own ADA code and color on the chart.

Does the system track which tooth surface was treated?

Yes. Record the surface precisely (occlusal, mesial, distal, buccal, lingual) — important for insurance claims and follow-ups.

Is treatment status clearly visible?

Yes. Move treatments through planned → in-progress → completed (or cancelled), with every transition timestamped in the patient record.

Does dental revenue show up on the dashboard alongside bookings and POS?

Yes. Completed treatments add their own layer to the revenue breakdown widget and the stacked revenue chart, so dental income is counted separately from booking and POS revenue but rolls into the same total.

Can I see the value of treatments that are planned but not yet completed?

Yes. The dashboard shows a "treatment pipeline" card with the total EGP value of all PLANNED treatments across patients. It's the single most useful number for follow-up calls — money already on the chart, waiting to be earned.

Can Orcaa track crowns and dentures sent to the dental lab?

Yes. Each piece gets a lab case — prosthetic type, teeth, shade, material, the lab it went to, the agreed price, and a due date — with live statuses from sent to fitted, including try-ins and remakes.

Will I know what I owe each dental lab at the end of the month?

Yes. Every lab has a statement: pieces made that month grouped by type at the prices you entered, total billed, payments recorded, and the outstanding balance — with aging so you know how old the debt is.

Does the patient know when their crown is ready?

Yes. The moment a piece is received from the lab, the patient gets an automatic notification, and reception and the treating dentist are alerted so the fitting appointment actually happens.

Which plan includes dental finance reports and AI insights?

The dental chart, procedures catalog, and full Gigx experience are on every plan for dental clinics. Gigx provides actions, insights and predictions, with voice coming soon for every Orcaa customer

Is Orcaa a complete dental practice management system?

Yes. Orcaa is a full dental practice management system — interactive tooth chart, patient records, bookings, billing, and financial reports, all in one place.

Try Orcaa for your dental clinic — 7 days free

Sign up in under a minute and start your interactive dental chart today

7-day free trial · no cardYour whole business in one place, ready in minutes